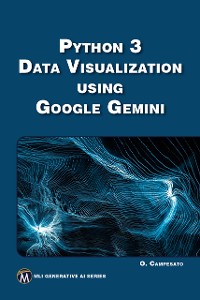
Python 3 Data Visualization Using Google Gemini
Mercury Learning and Information, Oswald Campesato
Naturwissenschaften, Medizin, Informatik, Technik / Informatik, EDV
Beschreibung
This book teaches Python 3 programming and data visualization, exploring cutting-edge techniques with ChatGPT/GPT-4 for generating compelling visuals. It starts with Python essentials, covering basic data types, loops, functions, and advanced constructs like dictionaries and matrices. The journey progresses to NumPy's array operations and data visualization using libraries such as Matplotlib and Seaborn. The book also covers tools like SVG graphics and D3 for dynamic visualizations.
The course begins with foundational Python concepts, moves into NumPy and data visualization with Pandas, Matplotlib, and Seaborn. Advanced chapters explore ChatGPT and GPT-4, demonstrating their use in creating data visualizations from datasets like the Titanic. Each chapter builds on the previous one, ensuring a comprehensive understanding of Python and visualization techniques.
These concepts are crucial for Python practitioners, data scientists, and anyone in data analytics. This book transitions readers from basic Python programming to advanced data visualization, blending theoretical knowledge with practical skills. Companion files with code, datasets, and figures enhance learning, making this an essential resource for mastering Python and data visualization.


